The motion sensor in the SpinWheel can be used to detect the direction of gravity, which in turn can be visualized, creating a colorful digital level or tilt sensor. In this adventure, we’ll cover one way to make a tilt sensor, which will also introduce vectors in a new way.
Simple Levels
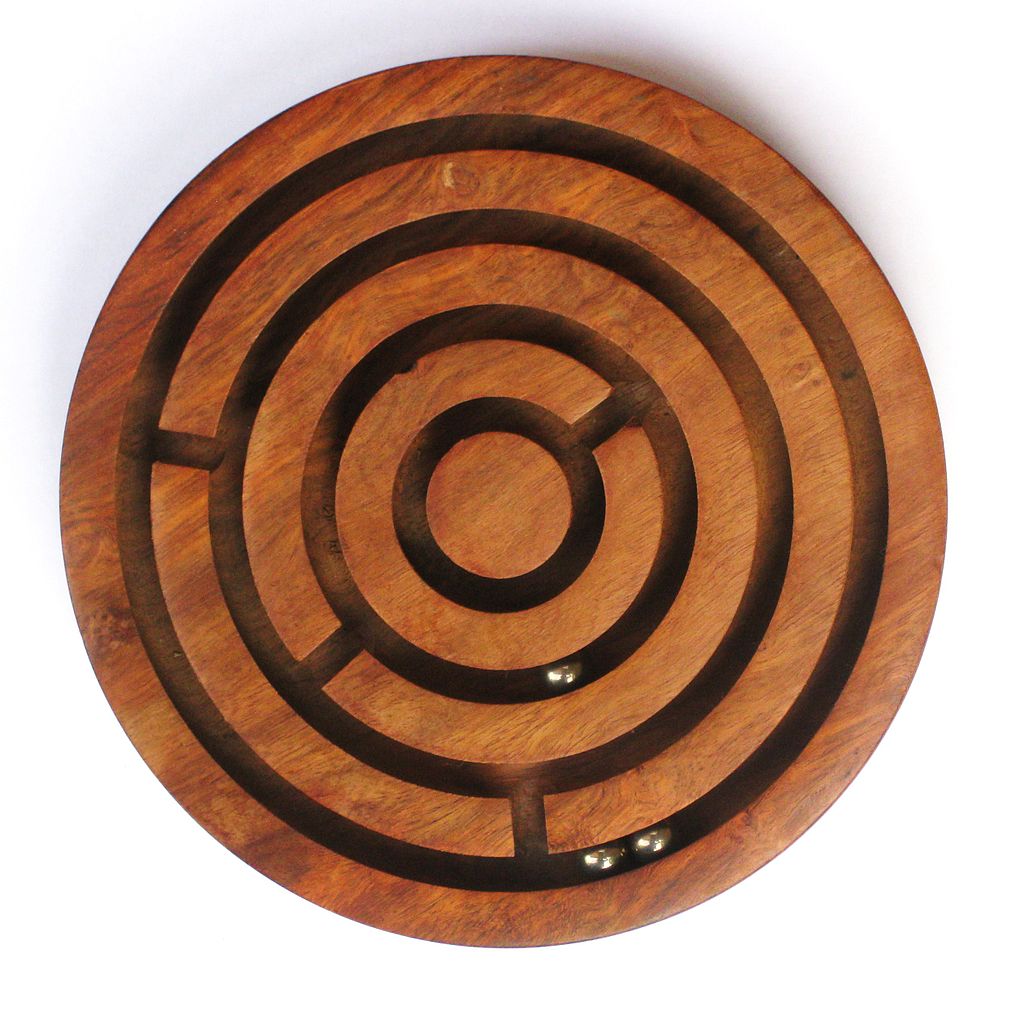
On our planet, what is horizontal and what is vertical is defined with respect to the direction of Earth’s gravitational pull. This makes it easy to measure how level a surface is by observing whether gravity can pull something off the surface. For example, what happens if you put a ball on a table that is not level? The ball will roll off and fall to the ground. One can even use a toy like a ball-in-a-maze puzzle as a simple tilt sensor.
More commonly, to check whether a surface is level or not, an actual bubble level is used. You may have tried using one when hanging pictures or other decorations on a wall!
To understand how a bubble level works, imagine what would happen if you took a glass of water and placed it on a table. If the table was perfectly horizontal, you would see the surface of the water in the glass appears horizontal too. What if the table has two legs that are slightly shorter than the others? Then, you might notice the surface of water in the glass appears tilted. You observe this tilt in the surface of the water because the surface is trying to remain perpendicular to gravity.
Now, what happens if you replace your water with soda? On the tilted table, you should observe the surface of the soda in the glass shifts to remain parallel to the ground, and the bubbles in your soda still rise straight up (perpindicular to the soda’s surface, but not to the bottom of the glass). Try this out and see what happens! The bubbles in your soda are made of gas (carbon dioxide in this case), and since carbon dioxide gas is less dense than your liquid soda, the gas bubbles rise to the top of the liquid soda.
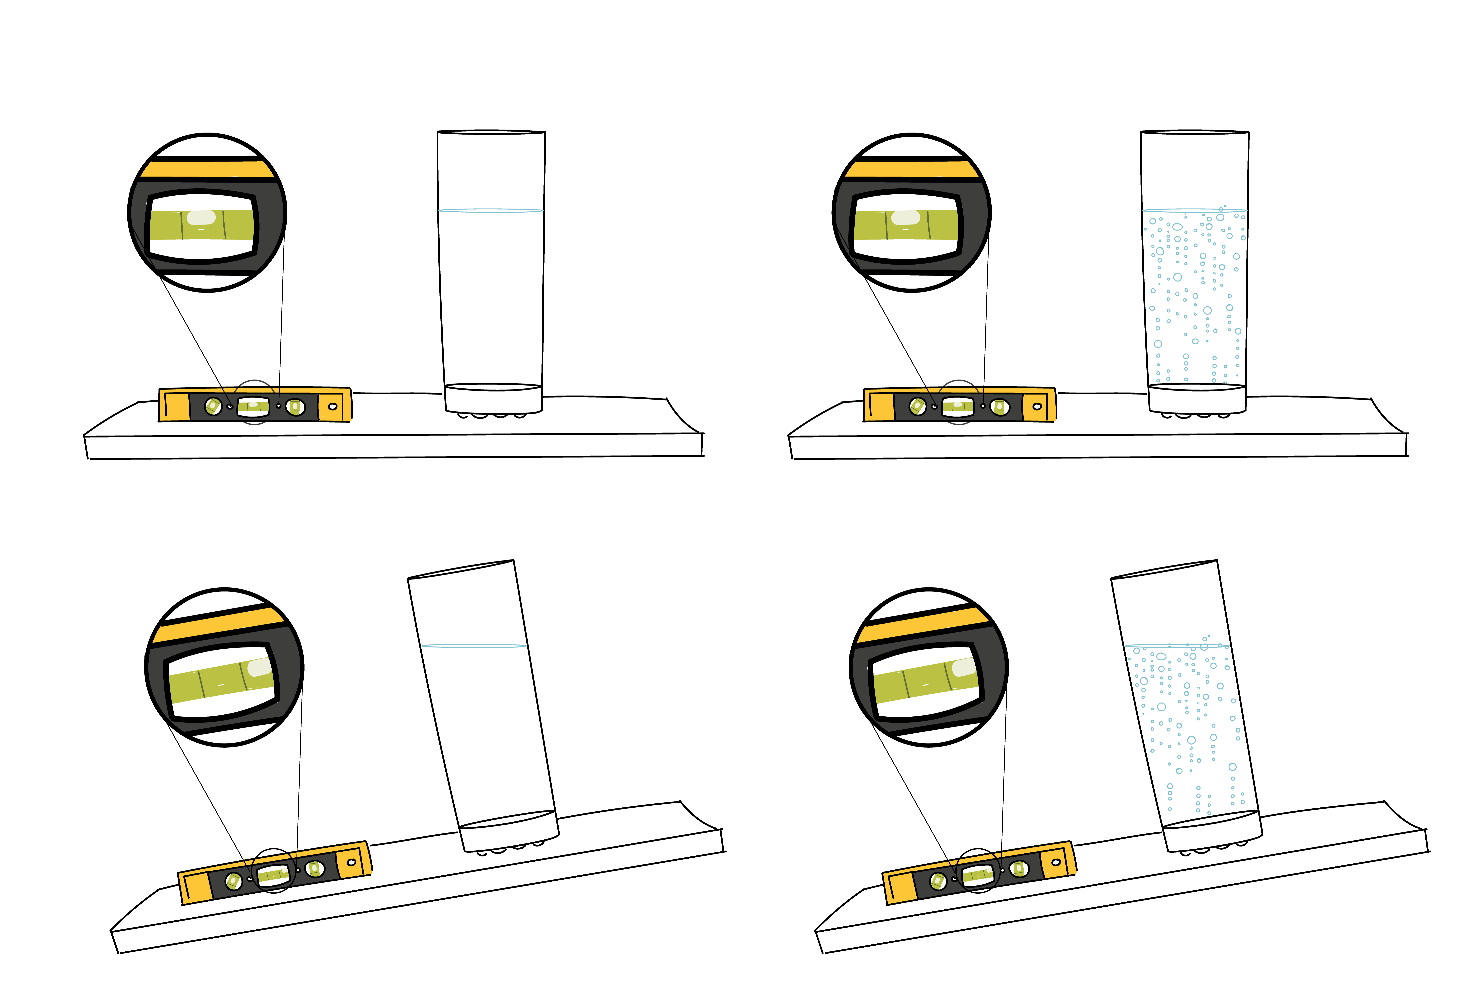
In a real bubble level, a small bubble is enclosed in a container with liquid surrounding it. The bubble tries to go as far up in its enclosure as possible, since the bubble is made of air and air is lighter than the surrounding liquid. This means that the bubble will rise against the direction of gravity (just think of what happened to bubbles in your soda glass). You can see this illustrated in the picture above where the bubble in the level on the tilted table rises to the highest point (to the right).
The top of the bubble level enclosure is slightly domed. This means that if the surface you’ve placed the level on is flat, the highest point in the bubble level enclosure is the center of level and the bubble will move there (since the bubble is trying to rise as far up as it can). If the surface is not flat, the bubble will still rise to the highest point in the enclosure, but the bubble will not be centered in this case.
We can program the SpinWheel to act as a level. The SpinWheel contains a motion sensor, which is capable of measuring acceleration. Because the sensation of accelerating cannot be distinguished from the sensation of being pulled by gravity, this same sensor also reports Earth’s gravity.
Before jumping into the rest of this adventure, upload the tilt sensor code from Examples → SpinWearables → Tilt_Sensor → Simple, and see how the LEDs respond to the tilt of the SpinWheel!
The indistinguishability of gravity and acceleration is a fascinating topic that has puzzled scientists and physics students for centuries. It even inspired Einstein to work on his general theory of relativity! You can learn more about it in our lesson on inertia and free fall.
Measuring Gravity in Two Dimensions
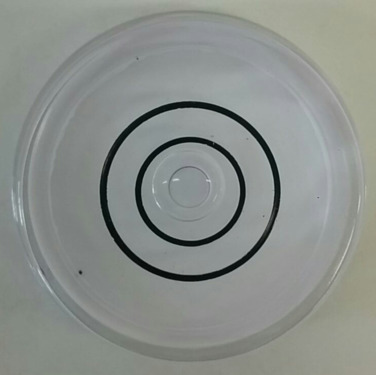
We can use the SpinWheel’s acceleration sensor to measure the direction of gravity with respect to the surface of the SpinWheel, which gives us the tilt of that surface. However we cannot use one single number to describe tilt, because we need both information about its left/right tilt and its forward/backward tilt. For instance, notice how in the bubble level above, both the direction in which the bubble has been displaced and the distance between the bubble and the center of the dome give information about the tilt of the surface. If a surface is more tilted, the bubble will move farther from the center, for instance.
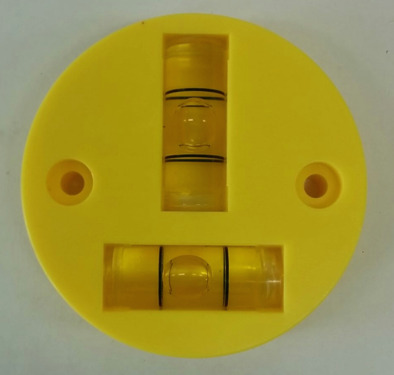
Other types of bubble levels show the left/right vs forward/backward tilt more directly. Notice how in the level shown below, we are using two separate tubes that are perpendicular to each other, instead of one single dome. Now we can use one number per bubble, simply denoting its displacement away from the middle of its tube. These two numbers together contain all the information about the tilt of the surface. We just described a position in the two-dimensional planeSomething that cannot be expressed by a single number., by using a pair of numbersEach giving the displacements along a single axis.. Mathematicians call this operation vector decomposition.
You can gain some more intuition about using two numbers to represent a position in a 2D plane below. Imagine that the bubble from the domed tilt sensor is at the end of the black arrow. The arrow gives the position of the bubble relative to the center of the dome, which depends on its tilt. This arrow is the two-dimensional objectHaving both length and direction in a 2D plane. that we want to represent by splitting it in a component along the \(x\) axis and a component along the \(y\) axis. The black arrow is called a vector. We also depict two tube bubble levels acting as left/right and forward/backward tilt sensors.
You can learn more about how to describe and work with quantities that have a direction from our lesson on vectors.
Measuring Gravity with the SpinWheel
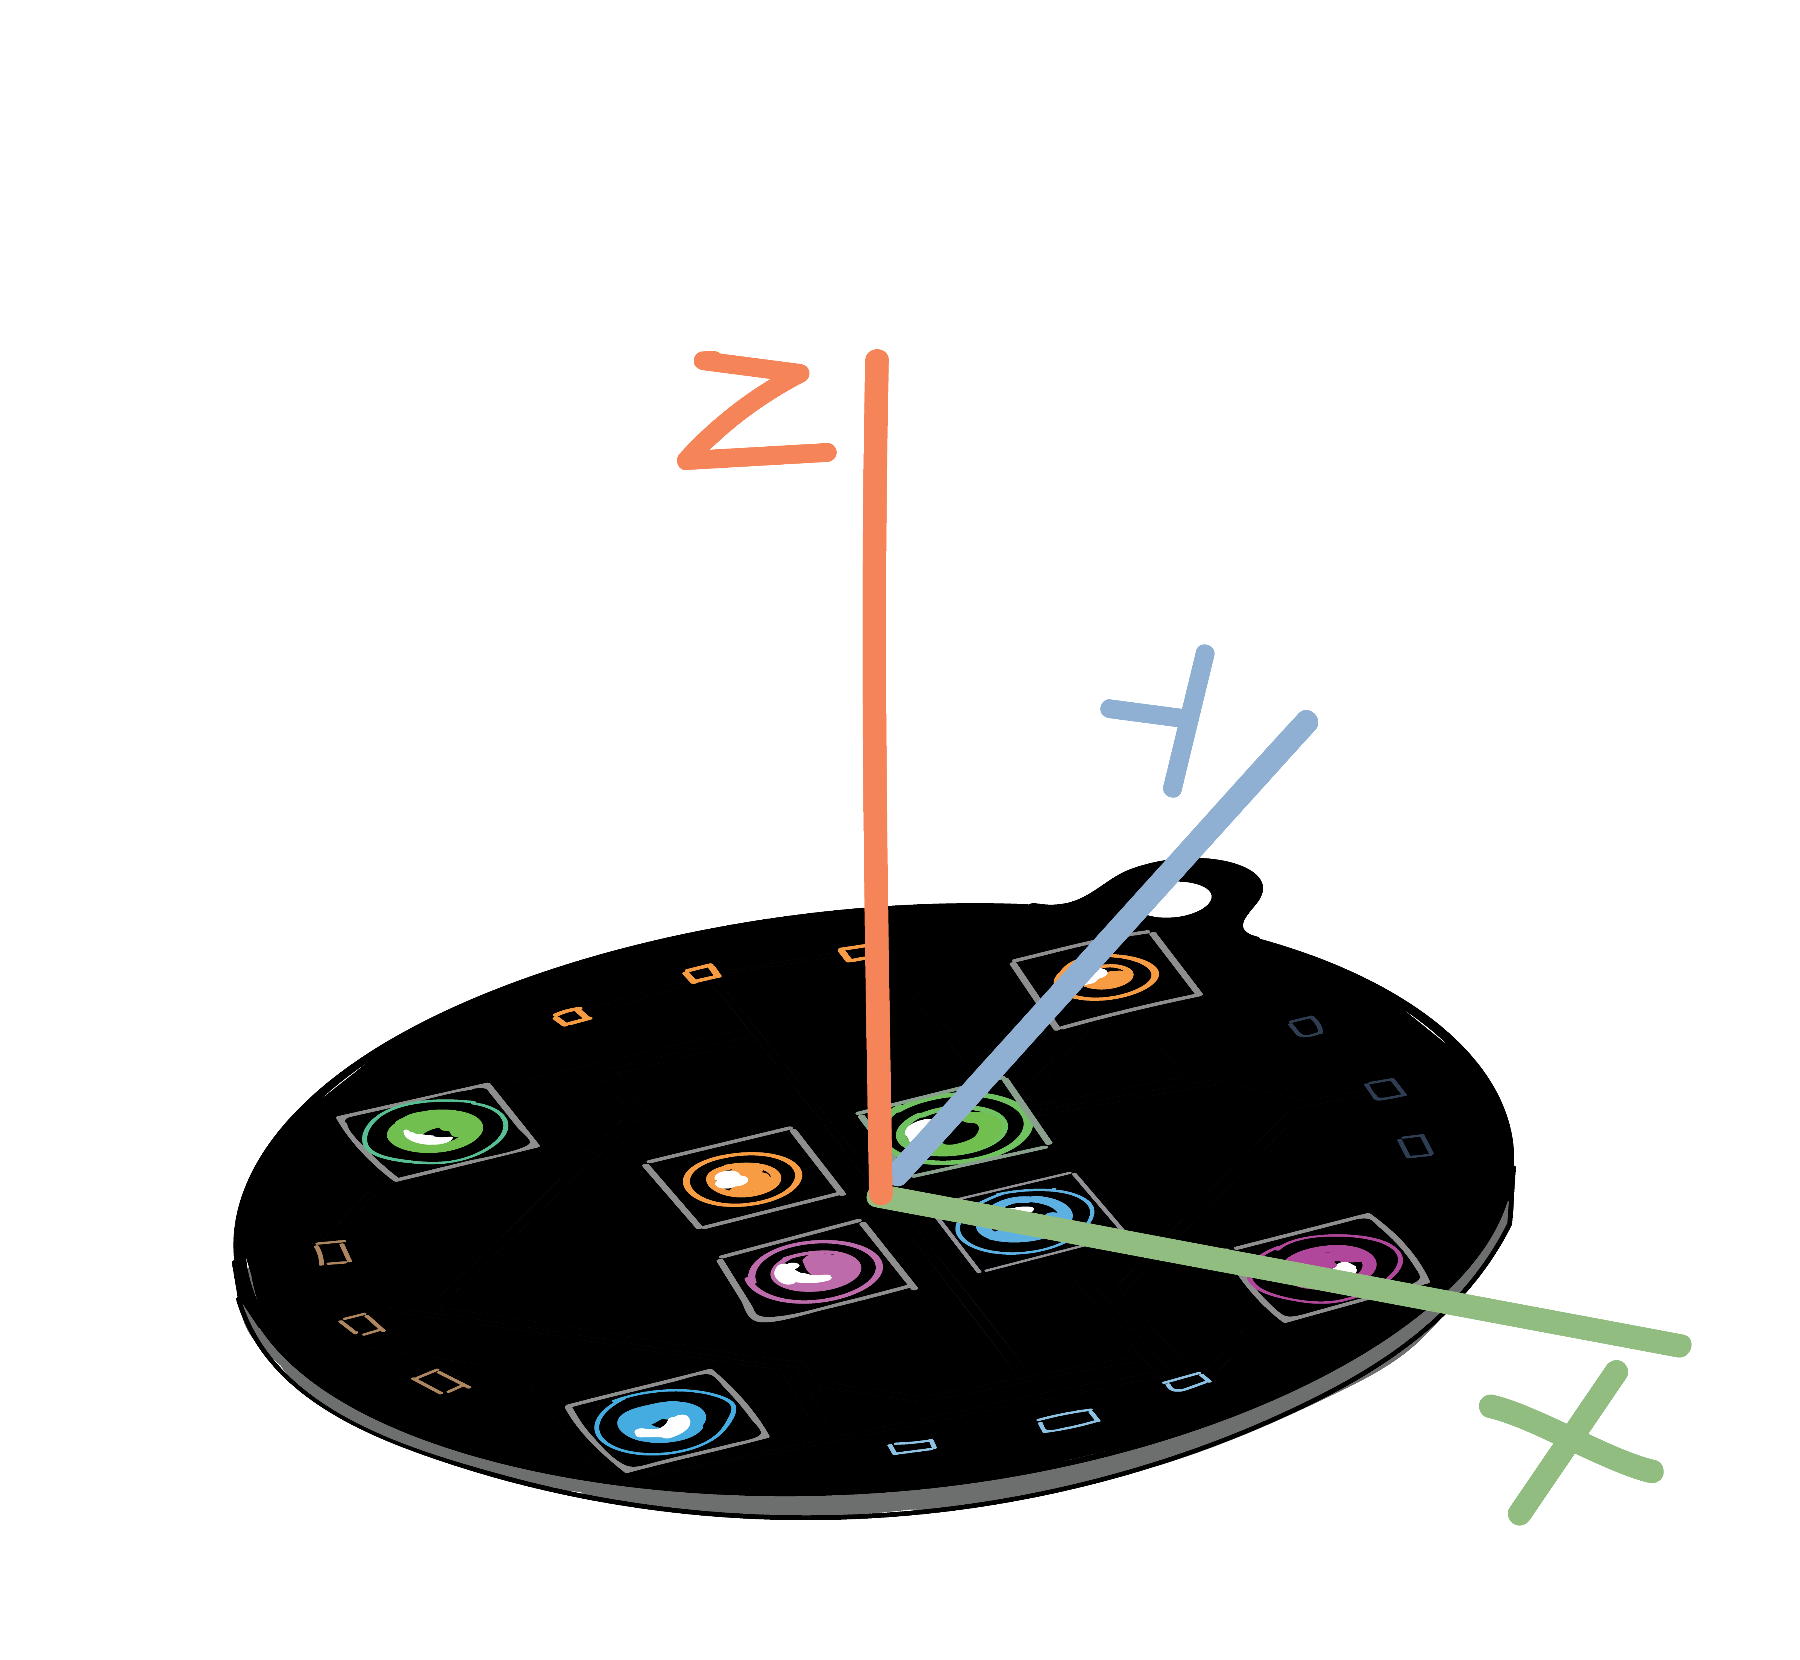
The SpinWheel has sensors that can measure gravity along three axesBelow the interactive SpinWheel animation, you can see how these three axes, x, y, and z, are defined.. In the visualization below you can see how different tilts will result in different measurement results: e.g., tilting left/right changes the measurement along the \(x\) axis. As you are playing with the sliders, pay close attention to the \(x\) and \(y\) components as they are the ones corresponding to the displacement of the air bubbles seen in the bubble levels above. The upright grey vector is the acceleration due to gravity, which is fixed with respect to the surface of Earth. That vector’s \(x\) and \(y\) components (shown below) give the \(x\) and \(y\) measurements we will be using.
Programming your own Tilt Sensor
Now that we have experimented with how the SpinWheel measures gravity, let’s start writing the code for the tilt sensor! To start, we’ll have two of the SpinWheel’s LEDs respond to tilt along the \(x\) axis. The SpinWheel will read the gravity and acceleration along the \(x\) axis, interpret that value as a description of the tilt along that axis, and then light up a corresponding LED along the same axis as appropriate.
From an Empty Sketch
We will build our tilt sensor program step by step, starting with this empty sketch. A good first step is to write some simple test code that just prints a few messages, confirming that your device is still functioning. For instance, copy the following code into your file. This code, once running on the SpinWheel, will repeatedly send the message “I am working!” to the computer that your SpinWheel is attached to. As always, we will add comments to the code, so that the purpose of each line is explained. (A comment is a line of code that is not run by the computer, but meant to be interpreted by humans. In this code, comment lines start with //).
You can consult our SpinWheel basic commands page to remind yourself how to read the computer code shown below. For more details about coding itself, check out the Coding Building Blocks page.
#include "SpinWearables.h"
using namespace SpinWearables;

void setup() {
  // Connect to the computer, so we can read status messages.
  Serial.begin(115200);
  // Ensure the special SpinWheel hardware is working.
  SpinWheel.begin();
}

void loop() {
  // Send a confirmation message over and over.
  Serial.println("I am working!");
}
If you upload this sketch to the SpinWheel, you won’t be able to see anything happen. It doesn’t turn on the LEDs, instead the sketch simply set ups the SpinWheel and sends a confirmation message (“I am working!”) repeatedly using Serial.println(). If you want to see this message, navigate to Tools -> Serial Monitor in the Arduino software.
Measuring Tilt
Now we can start working with measurements of tilt (direction of gravity) on the SpinWheel. We do this by calling the SpinWheel.readIMU() function to measure the three components of the gravitational vector (shown in grey in the visualization above). IMU stands for Inertial Measurement Unit: a fancy name for something that senses motion. This function will record 3 values, one for each direction of motion. Refer back to the image above to see how the \(x\), \(y\), and \(z\) axes are defined. To begin with, we will only use the \(x\) components of the measurement.
#include "SpinWearables.h"
using namespace SpinWearables;

void setup() {
  // Ensure all of the SpinWheel hardware is on.
  SpinWheel.begin();
}

void loop() {
  // Read all sensor data.
  SpinWheel.readIMU();

  // Save the x-axis measurement in a variable.
  int x = SpinWheel.ax*255;
}
In the sketch above, the measurement of gravity and acceleration along the \(x\) axis is contained in the SpinWheel.ax variable. We aren’t using this measurement to do anything yet, however. In the next section, we’ll begin changing the LEDs based on this information.
Responding to Tilt Along the X-axis
To make a useful level, we need the LEDs to change in response to how the SpinWheel is tilted. The code below lights up either large LED 5 or 7 depending on which LED is pointing down. Upload the below code onto your SpinWheel and experiment some to see how it works.
#include "SpinWearables.h"
using namespace SpinWearables;

void setup() {
  // Ensure all of the SpinWheel hardware is on.
  SpinWheel.begin();
}

void loop() {
  // Read all sensor data.
  SpinWheel.readIMU();

  // Save the x-axis measurement in a variable.
  int x = SpinWheel.ax*255;

  // Turn off all LEDs.
  SpinWheel.clearAllLEDs();

  // If the tilt is in a given direction,
  // turn on the corresponding LED.
  // We only want the SpinWheel to register
  // if the tilt is sufficiently large.
  if (x > 10) {
    SpinWheel.setLargeLED(5,-x, -x,-x);
  }
  else if (x < -10) {
    SpinWheel.setLargeLED(7, x, x, x);
  }

  SpinWheel.drawFrame();
}
Because the SpinWheel’s motion sensors are very sensitive, we only want the LEDs to light up if the SpinWheel tilts enough. We have decided that if SpinWheel.ax, or x in the code above, is bigger than 10We picked 10 arbitrarily and you can set it to a different value., then we want the LED to light up. You could decide to make your tilt sensor more or less sensitive by adjusting the value in the lines: if (x > 10) and else if (x < -10). You could instead have the LED on the side that is higher light up by swapping which LED is called (replacing 5 with 7 in the first instance of setLargeLED and 7 with 5 in the second instance, so your code looks like the following:
  if (x > 10) {
    SpinWheel.setLargeLED(7,-x, -x,-x);
  }
  else if (x < -10) {
    SpinWheel.setLargeLED(5, x, x, x);
  }
You can experiment with the code in other ways as well. For instance, you could change the color that LED 5 and 7 light up or have more LEDs also light up.
Improving the Tilt Sensor
If you want your tilt sensor to behave more like the second level in the pictures above, then you can upload a slightly more detailed version of the above code that senses both along the \(x\) and \(y\) axes. Go to the Examples menu in the Arduino software, and open the file here: Examples → SpinWearables → Tilt_Sensor → Simple. After looking at this version, feel free to modify the code further, creating more elaborate visualizations. A version similar to the one shown below can be found in Examples → SpinWearables → Tilt_Sensor → Fancy.
Both the Simple and the Fancy code examples can also be seen in your browser in literate programming renditions.
We have a list of visualization functions that can be of use when making more elaborate tilt visualizations. You might also be interested in the dancing with color or step counter adventures, which explore different ways to depict motion with the SpinWheel.
